Basic statistics
by Hasan
Measure of central tendency
- Mean
- Median
- Mode
Population and Sample
-
If all information required is in hand then population is used
- Sample is a subset of population
- Sample is used to reduce cost or when it is not possible to get all the population information.
Mean
- Sample and population mean is same.
Median
- Middle value of sorted data
Mode
- Observation that occurs most frequently
Measure of Dispertion
Standard devaitions or variants

- Variance is difference between population and sample
Random variables and Probability Distributions
-
Random variable is a quantity whose possible values depends, in some clearly-defined way, on a set of random events.
-
A probability distribution is essentially a theoritical model depicting the possible values a random variable may assume along with probability of occurance
Normal distribution
- Normal(mean, standard_deviation)
- When mean 0, standard deviation 1 then standard normal distribution
import numpy as np
import matplotlib.pyplot as plt
from scipy.stats import norm
x_axis = np.arange(-4, 4. 0.1)
plt.plot(x_axis, norm.pdf(x_axis, 0, 1))
plt.show()
T distribution
- Students t-distribution
- Normal distribution describes the mean of population where the T-distribution describes the mean of the sample drawn from a population.
- The T-distribution for each sample could be different.
-
When sample size is big, then T-disribution resemble the normal distribution.
-
When Degree of freedom increases then t distribution turns into Normal distribution
-
Assumptions required for t distribution
- Scale of measurement –> follows continuous or ordinal scale.
- Simple random sample –> representative randomly selected of a population.
- Bell shaped distribution –> when plotted follow normal distribution.
- Homogeneity of variance-> test required to test this. To avoid the test statistics to be biased against the larger sample sizes.
Probability of getting a high or low teaching evolution.
import scipy.stats
prob = scipy.stats.norm.cdf((
    (X- mean) / std
))
prob_greater_than = 1- prob
When to test t-test or Z-test
-
When population’s standard deviation is known then Z-test otherwise t-test
-
4 Scenarios
- We are comparing sample mean to a population mean and standard deviation of population is known then Z test.
- We are comparing sample mean to a population mean and standard deviation of population is not known then T test.
- Comparing means of two independent samples with unequal variance. Always use T Test.
- Comparing means of two independent samples with equal variance. Always use T Test.
* Z test normal distribution and t-test T distribution.

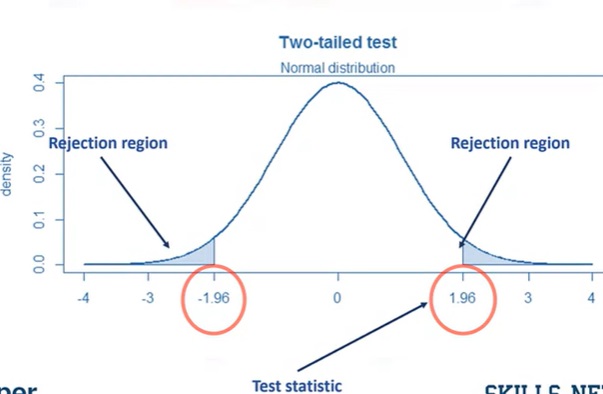
Dealing with tails and rejection

Equal vs Unequal Variances
- A t-test called Leven’s Test to assess the equality of variances
- Null hypothes Ho: Population variances are equal
- If p < 0.05 reject null hypothesis
scipy.stats.levene(
    first_var,
    second_var,
    center='mean'
)
- In case of p_value 0.05 e.g. we have a
p_value = 0.66we can say the variances are equal. - So where it will be used. When we will run t-test we set the option, equal_var = True
scipy.stats.ttest_ind(
    first_var,
    second_var,
    equal_var=True
)
ANOVA
- when comparison is done between more than two groups then ANOVA is used
- F distribution is used
- Null hypothesis is mean are same
- We fail to reject null hypothesis if the p value F test > 0.05 and means same mean
# Three variables are
# forty_lower, forty_fifty_seven, fiftyseven_older
f_statistics, p_value = scipy.stats.f_oneway(
    forty_lower,
    forty_fifty_seven,
    fiftyseven_older
)
print(f'F statistics = {f_statistics}\n and P value is = {p_value}')
Correlation
-
Categorical variable
-
Chi-square Test
- But start with a cross tab
-
- Null hypothesis Ho: No relation
- Alternative hypothesis H1: they are related
scipy.stats.chi2_contingency(
    cont_table,
    correction=False
)
# first value = chi_squaure test value
# second value is p value
# Degree of freedom third value
# last array expected values
-
Continuous Variable
-
pearson Correlation
- But start with a scatter plot
-
- Null hypothesis Ho: No relation
- Alternative hypothesis H1: they are related
pearson_value, p_value = scipy.stats.pearsonr(
                         first_variable
                         second_variable
                         )
Regression in place of T-test
scipy.stats.ttest_ind(
    first_var,
    second_var,
    equal_var=True
)
import statsmodel.api as sm
X = first_var
y = second_var
X =  sm.add_constant(X)
model = sm.OLS(y, X).fit()
predictions = model.predict(X)
model.summary()
Regression in place of ANOVA
import statsmodel.api as sm
from statsmodel.formula.api import ols
lm = ols('beauty ~ age_group' data = ratings_df).fit()
table = sm.stats.anova_lm(lm)
print(table)
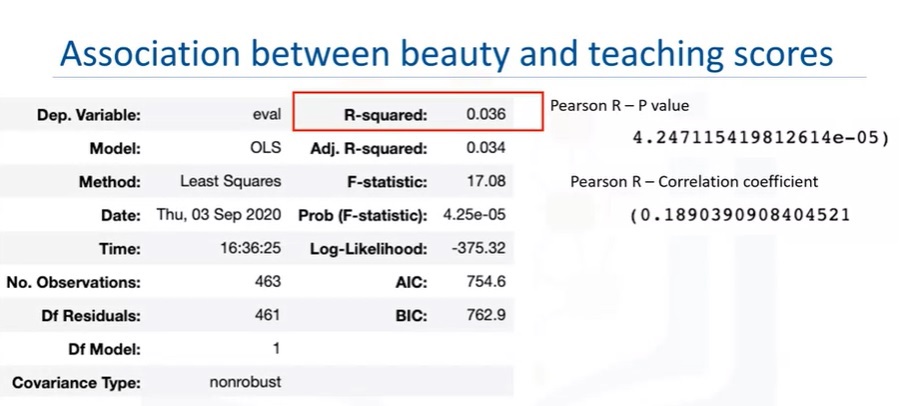
Regression in place in Correlation
import statsmodel.api as sm
X = first_var
y = second_var
X =  sm.add_constant(X)
model = sm.OLS(y, X).fit()
predictions = model.predict(X)
model.summary()
